Six Panel Plotting
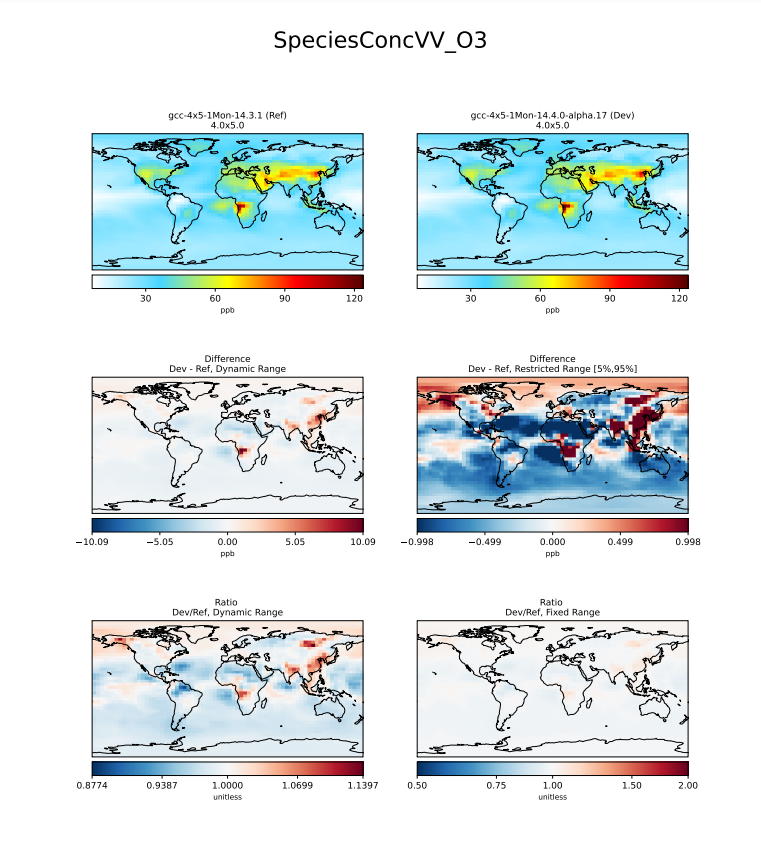
This example demonstrates GCPy’s comparison plotting capabilities. Following the example below will generate a plot similar to this:
Source code
Script location: gcpy/examples/plotting/plot_comparisons.py
Calling sequence
Make sure that you have specified the proper Matplotlib backend for your system. Then run the example with:
$ python -m gcpy.examples.plotting.plot_comparisons \
  --ref   /path/to/ref/diagnostic/or/restart/file \
  --dev   /path/to/dev/diagnostic/or/restart/file \
  --var   variable-name-to-plot \
  --level level-to-plot
Note that the level-to-plot starts from 0.
For example, to plot July 2019 ozone concentrations at the surface level from two different GEOS-Chem simulations, you would use this command:
$ python -m gcpy.examples.plottings.plot_comparisons \
  --ref   /path/to/ref/GEOSChem.SpeciesConc.20190701_0000z.nc4 \
  --dev   /path/to/dev/GEOSChem.SpeciesConc.20190701_0000z.nc4 \
  --var   SpeciesConcVV_O3 \
  --level 0