Single Panel Plotting
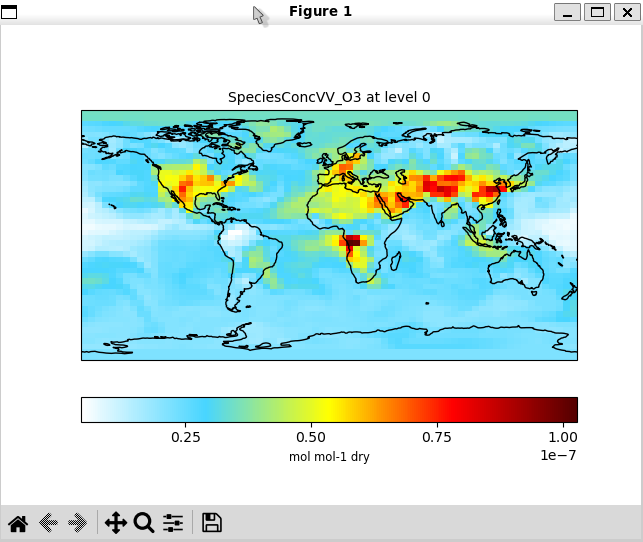
This example demonstrates GCPy’s single-panel plotting capabilities. Following the example below will generate a series of plots such as this surface-level ozone concentrations plot:
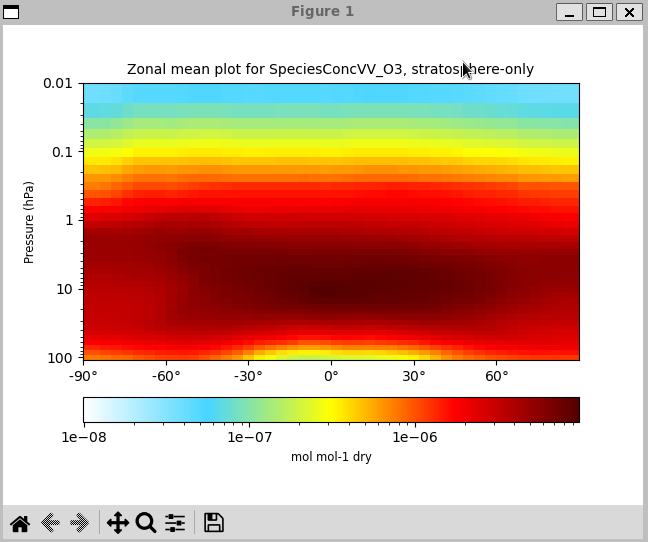
and this zonal mean plot:
Source code
Script location: gcpy/examples/plotting/plot_single_panel.py
Usage
Make sure that you have specified the proper Matplotlib backend for your system. Then run the example with:
$ python -m gcpy.examples.plotting.plot_single_panel \
  --infile   /path/to/ref/diagnostic/or/restart/file \
  --varname  variable-name-to-plot \
  --level    level-to-plot
Note that the level-to-plot starts from 0.
For example, to plot July 2019 ozone concentrations, you would use the command below. Data from the surface level is used for the single-level plot.
$ python -m gcpy.examples.plotting.plot_single_panel \
  --infile  /path/to/GEOSChem.SpeciesConc.20190701_0000z.nc4 \
  --varname SpeciesConcVV_O3 \
  --level 0